
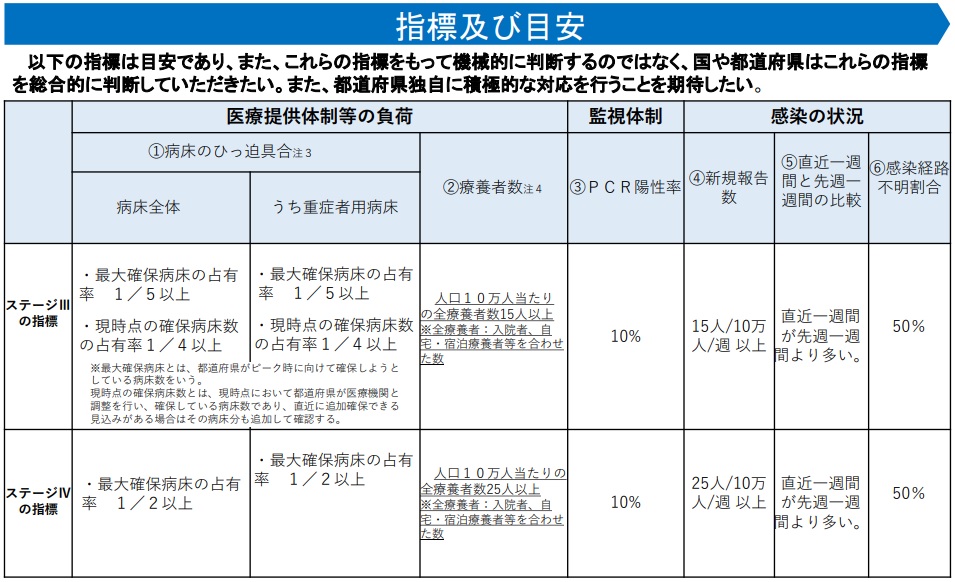
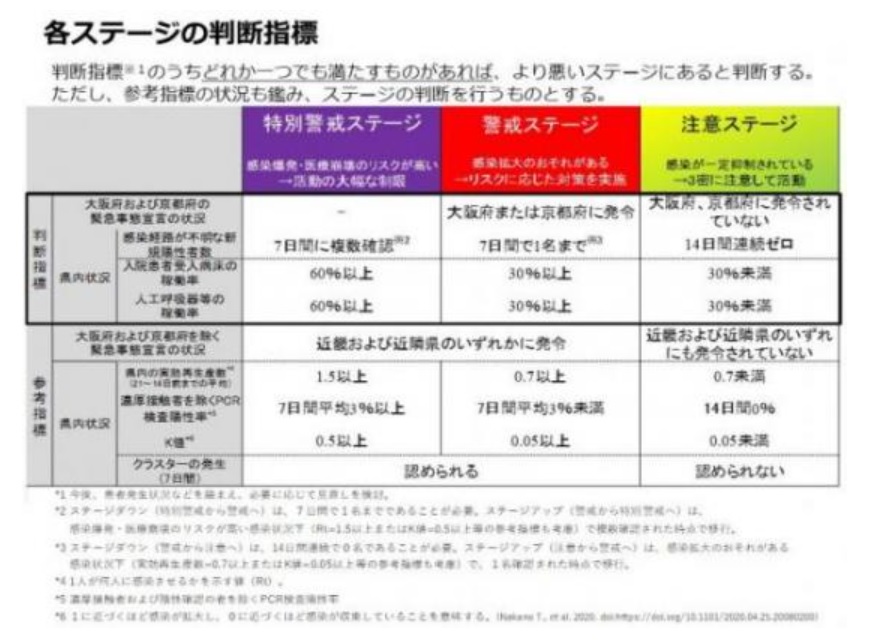
「新型コロナウイルス感染症対策分科会」は流行状況を4段階に分け、各段階での対策とステージ判定の指標を公表しました。
各都道府県は独自でモニタリング指標を設定しています。
https://www.cas.go.jp/jp/seisaku/ful/kongo_soutei_taisaku.pdf
Contents
北海道、東北
北海道
http://www.pref.hokkaido.lg.jp/ss/ssa/0904_keikaisetsumei.pdf
陽性率、新規報告数は分科会の指標を踏襲しています。
新規報告数については1日平均113人以上でステージ4、189人以上でステージ5となります。
北海道の最大陽性者数は4月23日の45人ですので明らかに多すぎると思います。
宮城

https://www.pref.miyagi.jp/uploaded/attachment/811688.pdf
新規感染者数についてステージ3は10万人あたり2.2人/週、ステージ4は10万人あたり4.3人/週となっています。(宮城県の人口は233万人)
(分科会指標の約5分の1)
秋田
https://www.pref.akita.lg.jp/pages/archive/51498
新規感染者数のみでステージ分類を行っています。
10万人あたり2.4人以上でレベル4、10万人あたり4.9人以上でレベル5となっています。(秋田の人口は102万人)
(分科会指標の約5分の1)
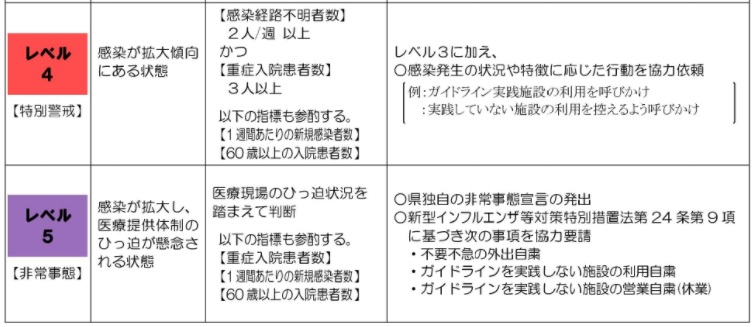
山形
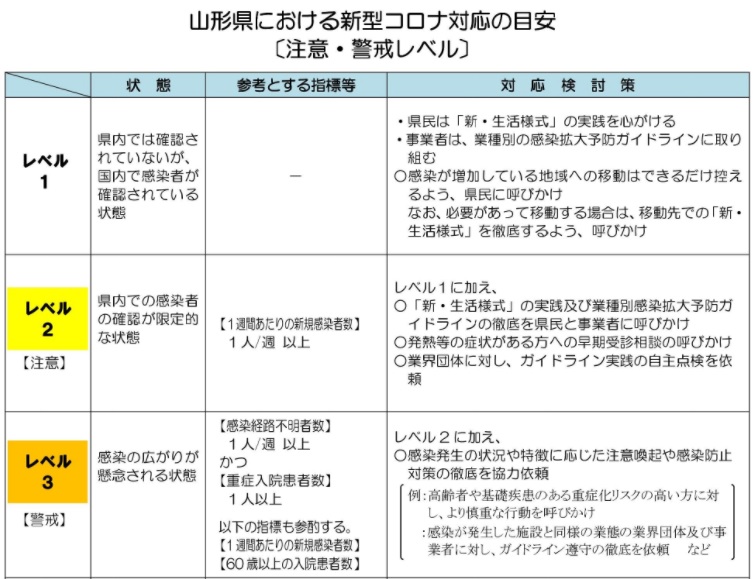
https://www.pref.yamagata.jp/ou/bosai/020072/kochibou/coronavirus/coronavirus.html#level
新規感染者数、感染経路不明者数等でステージ分類を行っています。
青森、岩手、福島
なし
北信越
新潟
https://www.pref.niigata.lg.jp/site/shingata-corona/
新規感染者数について10万人あたり0.26人以上/週で注意報、10万人あたり0.52人以上/週で警報となっています。(新潟の人口は230万人)
(分科会指標の10分の1以下)
富山
http://www.pref.toyama.jp/cms_sec/1205/kj00022038.html
新規陽性者数については10万人あたり0.25人/週となっています。
(分科会指標の10分の1)
石川
https://www.pref.ishikawa.lg.jp/kansen/monitoring.html
福井
https://www.pref.fukui.lg.jp/doc/kenkou/kansensyo-yobousessyu/corona.html
新規感染者について10万人あたり2.5人以上/週で警報、10万人あたり6.4人以上/週で特別警報となっています。(福井の人口は78万人)
(分科会指標の約4分の1)
関東
茨城
https://www.pref.ibaraki.jp/1saigai/2019-ncov/kaiken200805.html
陽性者数について10万人あたり0.21人以上でStage3、10万人あたり0.34人以上でStage4となっています。(茨城の人口は291万人)
(分科会の指標の約10分の1)
栃木

http://www.pref.tochigi.lg.jp/e04/documents/keikaido_20200910.pdf
新規感染者数について10万人あたり2.5人以上/週で感染厳重注意、5.0人以上/週で特定警戒となっています。(栃木の人口は197万人)
(分科会指標の約5分の1)
千葉
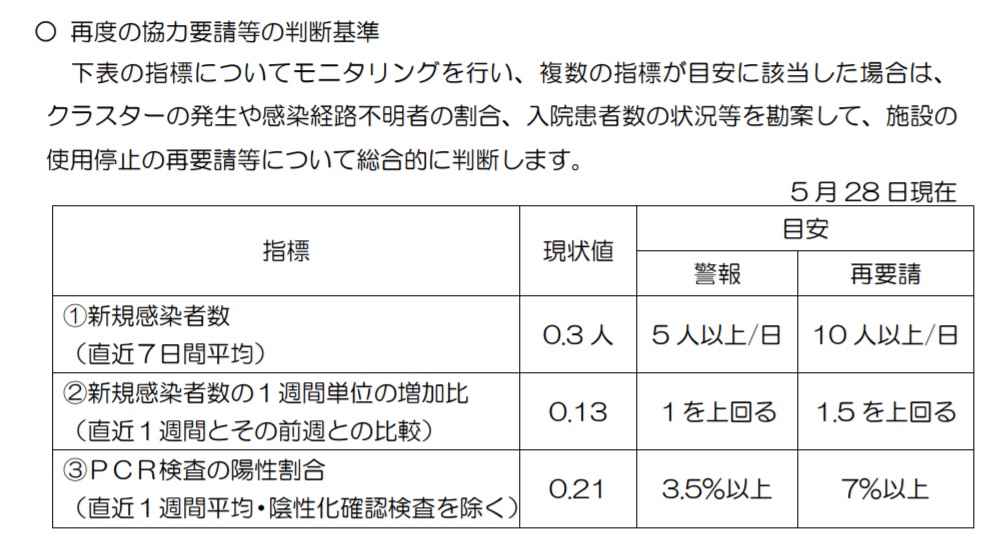
https://www.pref.chiba.lg.jp/shippei/kansenshou/documents/0528sihyou.pdf
5月28日以降は更新されていないようです。
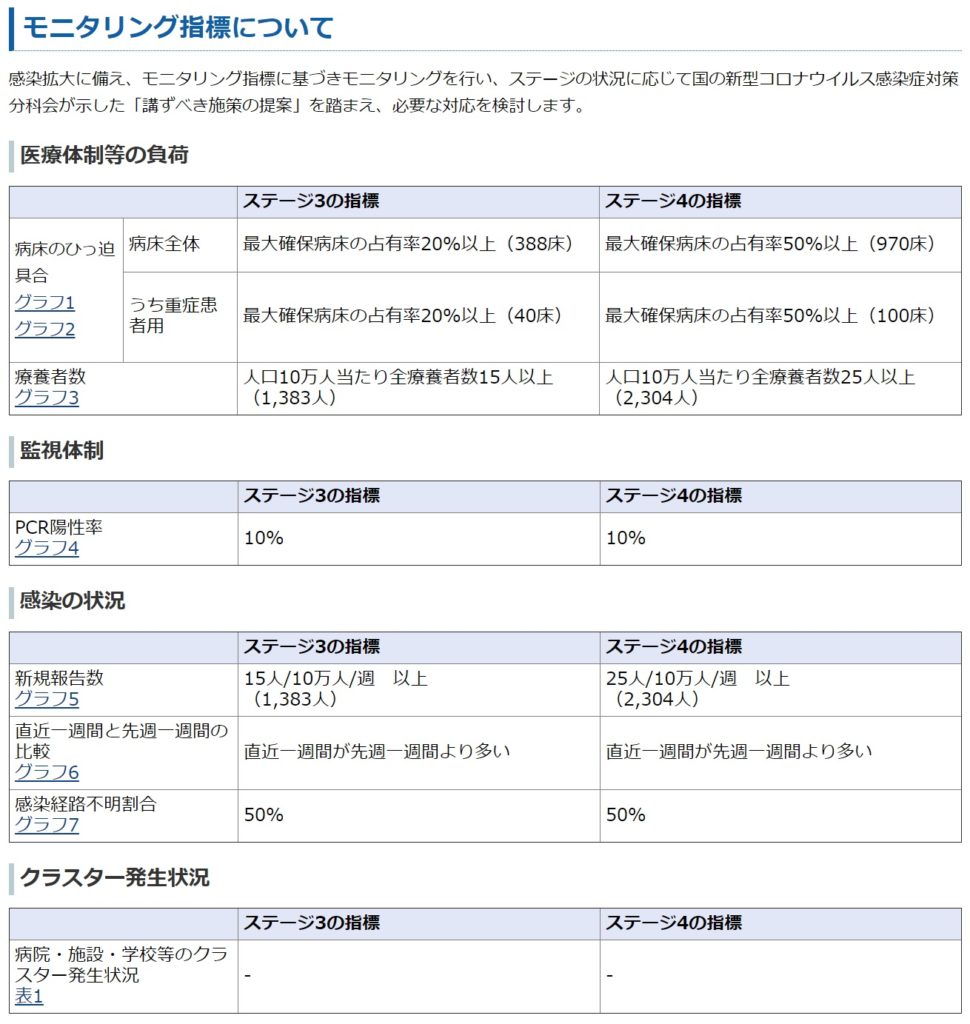
東京
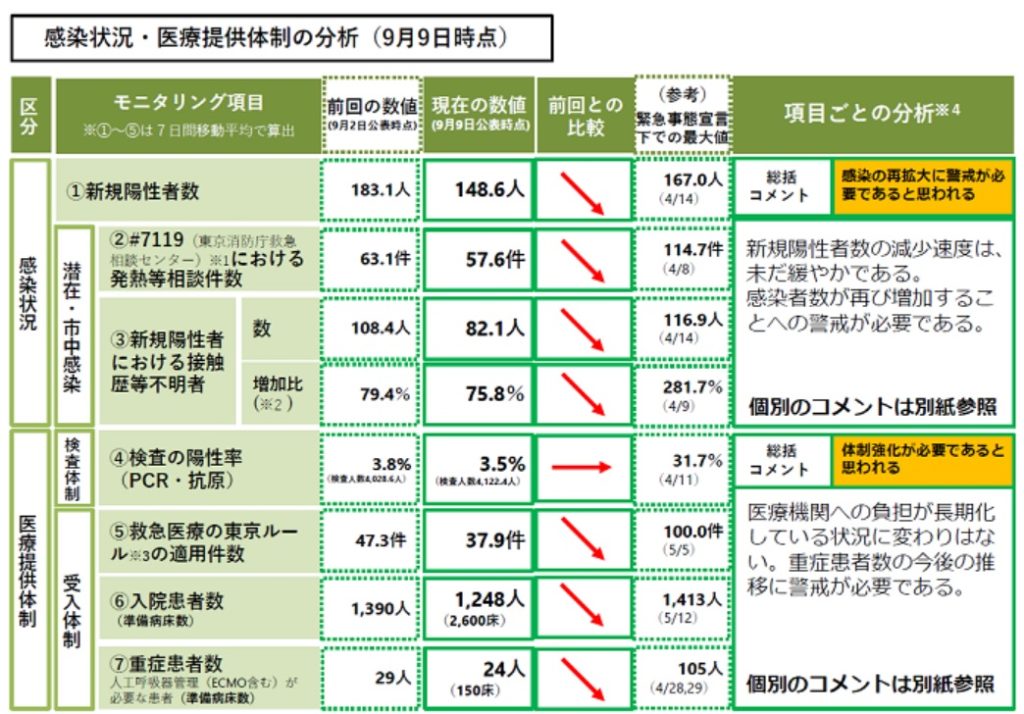
https://www.fukushihoken.metro.tokyo.lg.jp/iryo/kansen/monitoring.html
細かすぎてよくわかりません。
ステージ分類は総合的に判断となっています。
神奈川
https://www.pref.kanagawa.jp/docs/ga4/covid19/k-vision/indicator.html#sankou
分科会の指標を踏襲しています。
新規報告数は1日あたり197人以上でステージ3です。
神奈川の最大新規報告数は8月15日の136人ですので明らかに多すぎます。
K値を採用していたはずですがいつの間にか消えています。
群馬、埼玉
なし
中部
長野
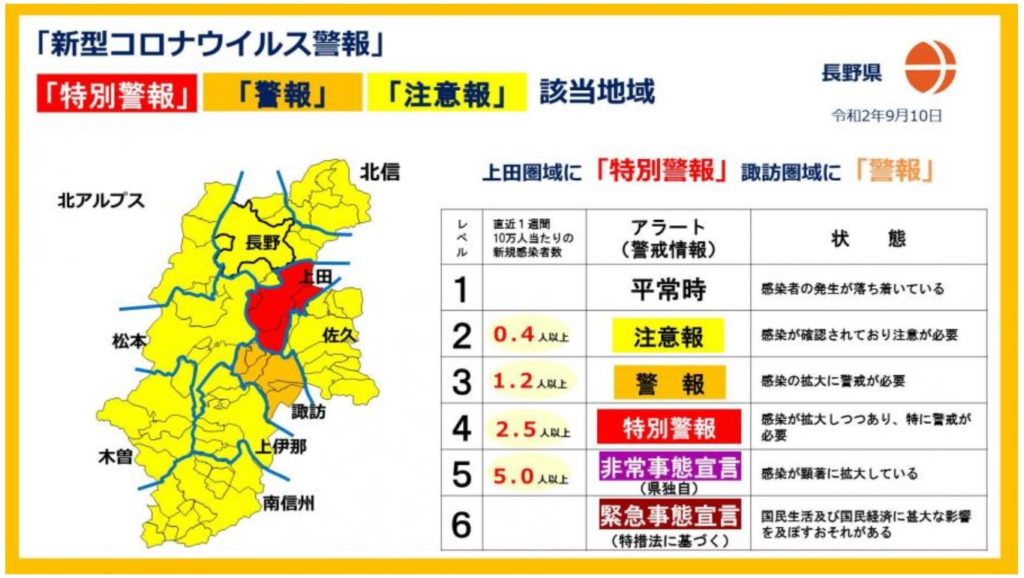
https://www.pref.nagano.lg.jp/hoken-shippei/kenko/kenko/kansensho/joho/corona-sengen.html
新規感染者数については10万人あたり2.5人以上/週で特別警報、5.0人以上/週で非常事態宣言となっています。
(分科会指標の約5分の1)
岐阜

https://www.pref.gifu.lg.jp/kinkyu-juyo-joho/shingata_corona_kansendoko.html#doukou
基準となる新規感染者数は10万人あたり0.33人/週となっています。(長野の人口は209万人)
静岡
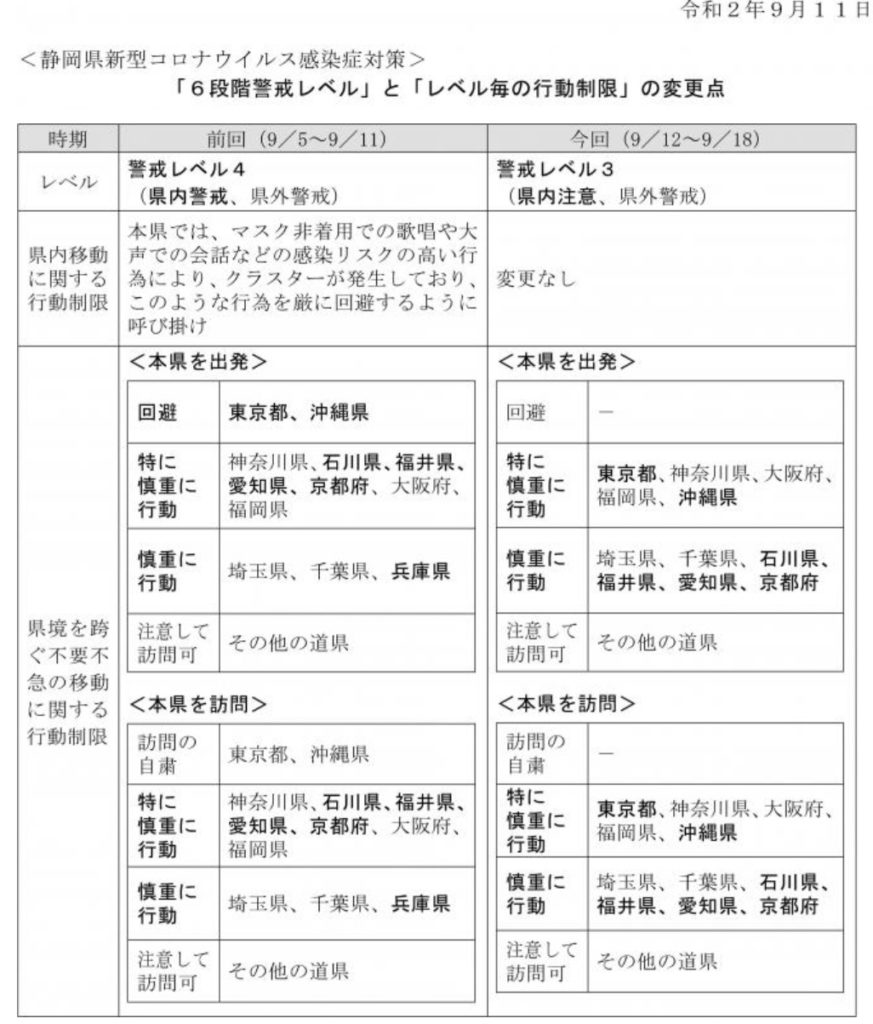
https://www.pref.shizuoka.jp/kinkyu/covid-19-keikailevel.html
他県との往来が多いためか、独自の指標となっています。
三重

https://www.pref.mie.lg.jp/common/content/000908225.pdf
基準となる新規感染者数は10万人あたり0.55人/5日となっています。(三重県の人口は181万人)
山梨、愛知
なし
近畿
滋賀
https://www.pref.shiga.lg.jp/ippan/bousai/sougo/311971.html
元画像がぼやけてます。
「コロナとのつきあい方滋賀プラン」という変わった名称になってます。
驚いたことにK値を採用しています。
京都
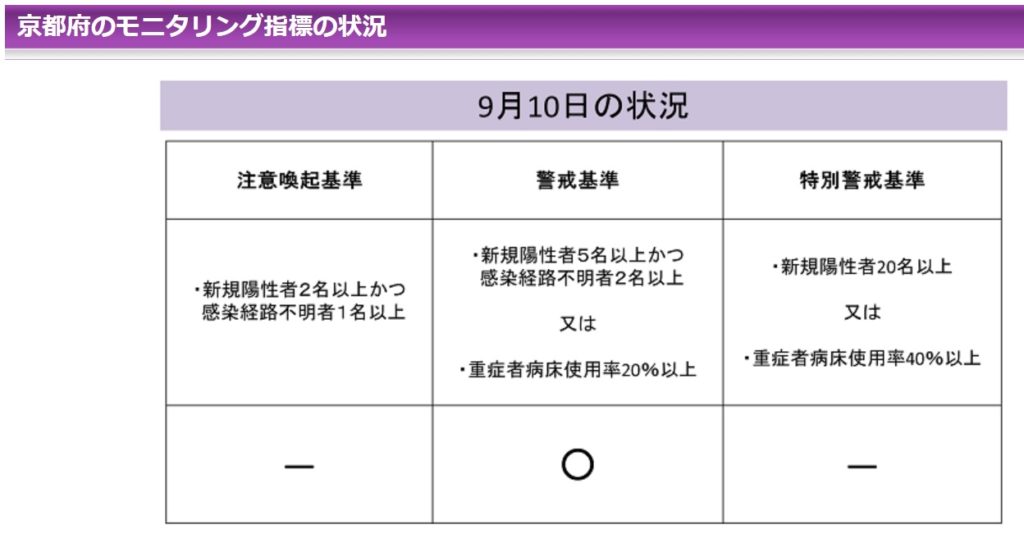
https://www.pref.kyoto.jp/kentai/corona/tassei_jyokyo.html
新規陽性者について10万人あたり0.19人以上で警戒、10万人あたり0.77人以上で特別警戒となっています。(京都府の人口は261万人)
(分科会指標の約5分の1)
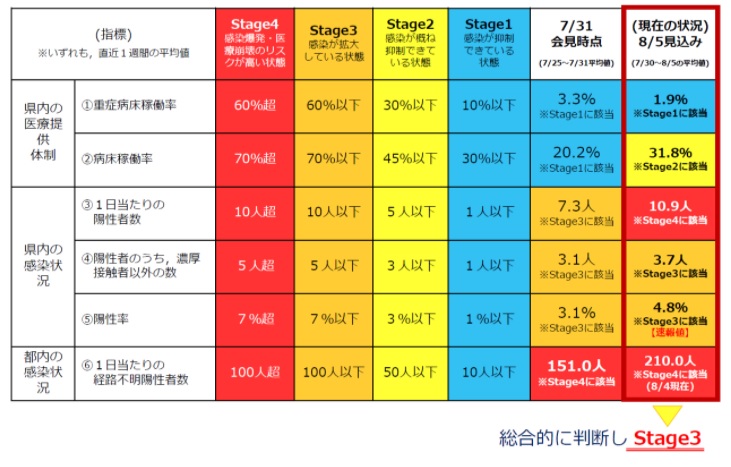
大阪
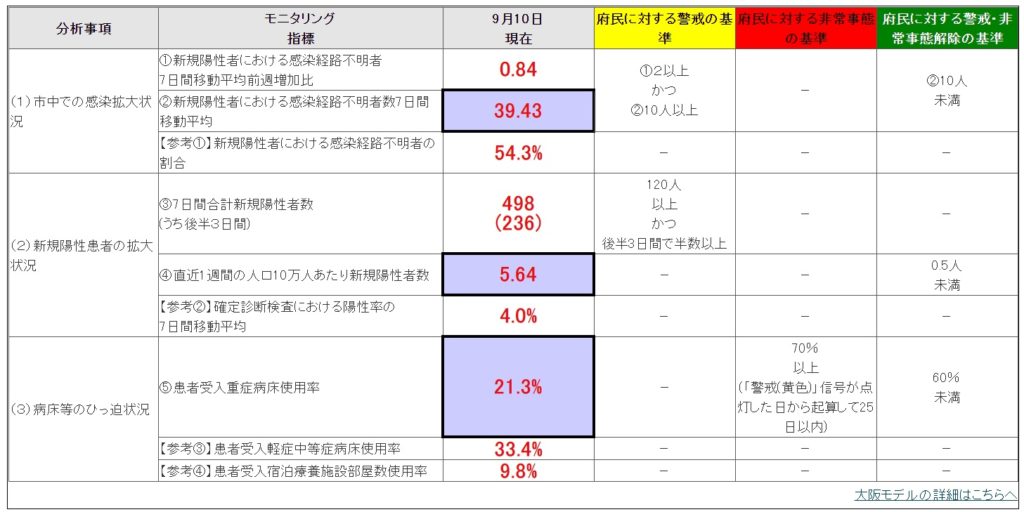
http://www.pref.osaka.lg.jp/default.html
突然非常事態になってしまいそうなモニタリング指標です。
大阪モデルについては下記の記事でも触れてます。

和歌山

https://www.pref.wakayama.lg.jp/prefg/041200/d00203387.html
他府県との往来が原因による陽性者が多いため、独自の指標となっています。
兵庫、奈良
なし(奈良県にはありませんが奈良市にはあります)
中国
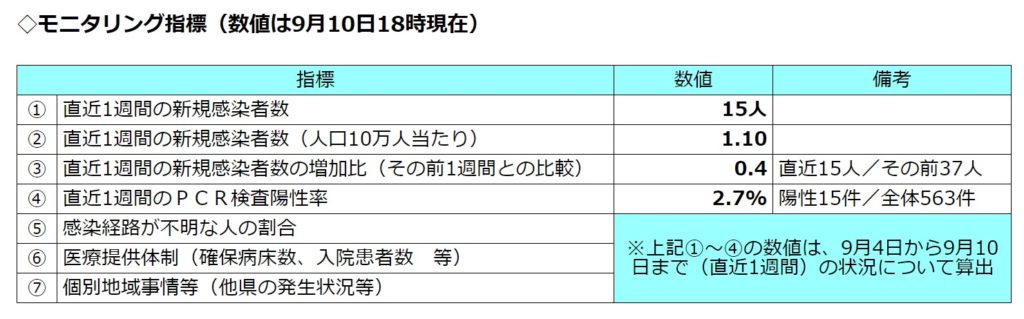
鳥取
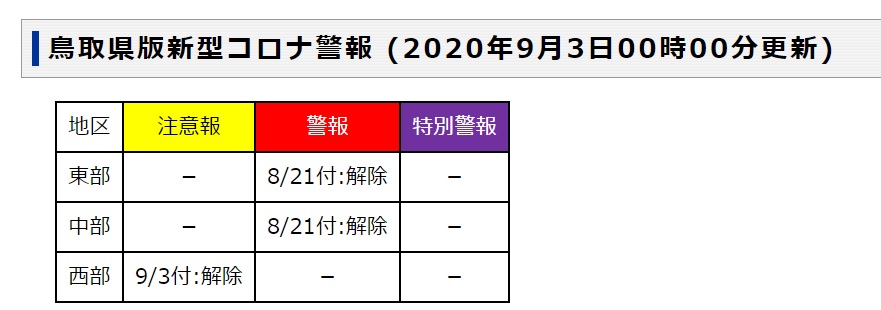
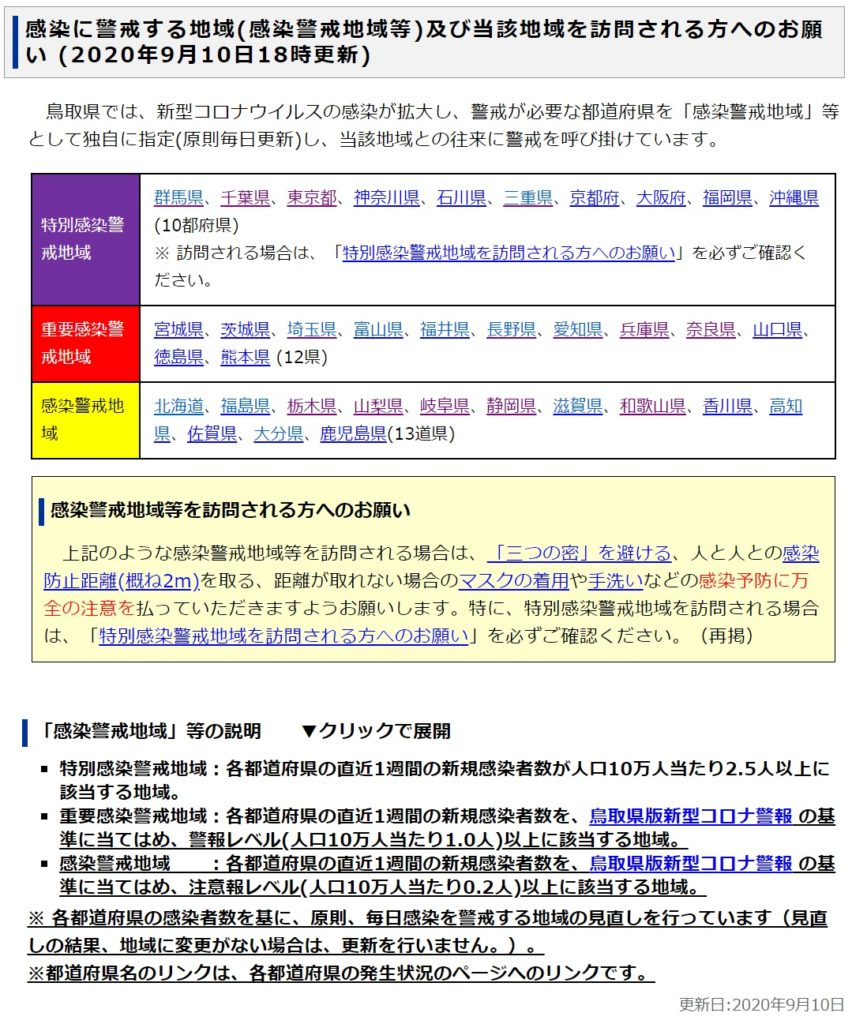
https://www.pref.tottori.lg.jp/corona-virus/
原則毎日更新しているそうです。
特別感染警戒地域は新規感染者数が10万人あたり2.5人/週となっています。
(分科会指標の約10分の1)
島根
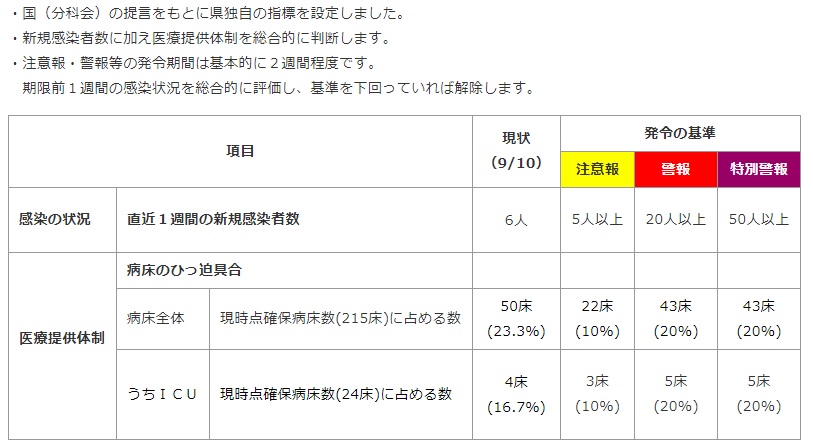
山口
https://www.pref.yamaguchi.lg.jp/cms/a10000/korona2020/202007270002.html
岡山、広島
なし
四国
徳島
https://anshin.pref.tokushima.jp/docs/2020082100038/files/shihyou200911.pdf
新規報告者数について10万人あたり4人以上/週でステージⅡ、10万人あたり13.3人以上/週でステージⅢとなっています。(徳島の人口は75万人)
(分科会指標の約2分の1)
高知
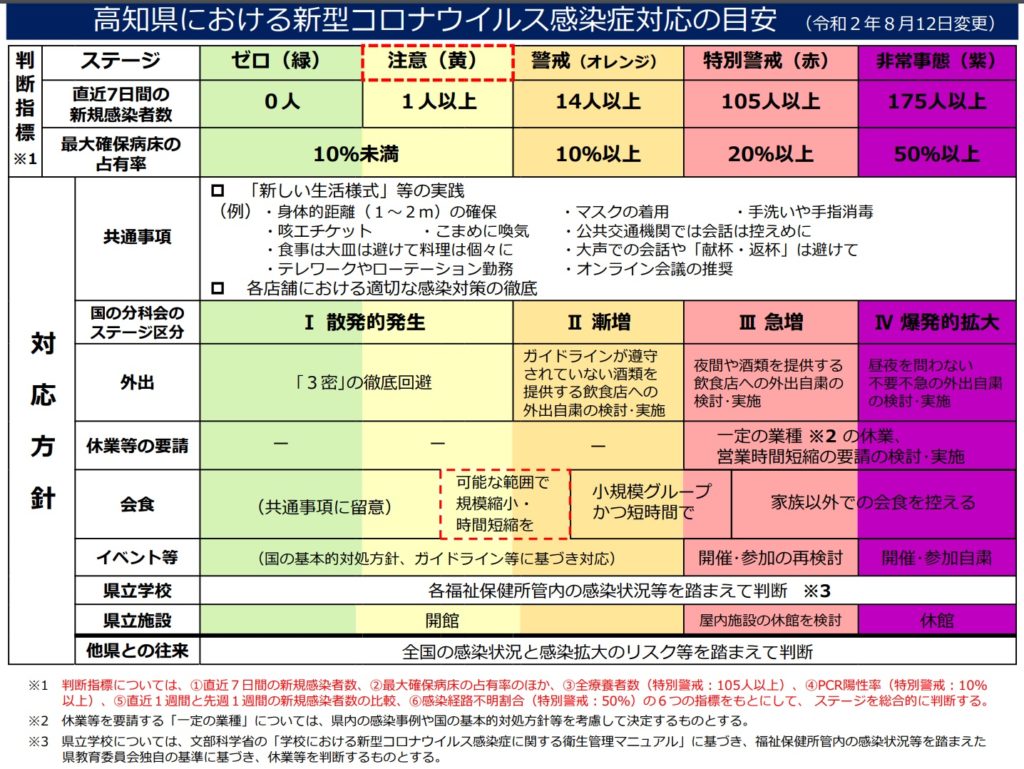
https://www.pref.kochi.lg.jp/soshiki/111301/files/2020043000315/file_2020982172236_1.pdf
新規感染者数については10万人あたり1.9人/週で警戒、10万人あたり14.5人/週で特別警戒、10万人あたり24.3人/週で非常事態となっています。(高知の人口は72万人)
(分科会の指標に近いです)
香川、愛媛
なし
九州
福岡
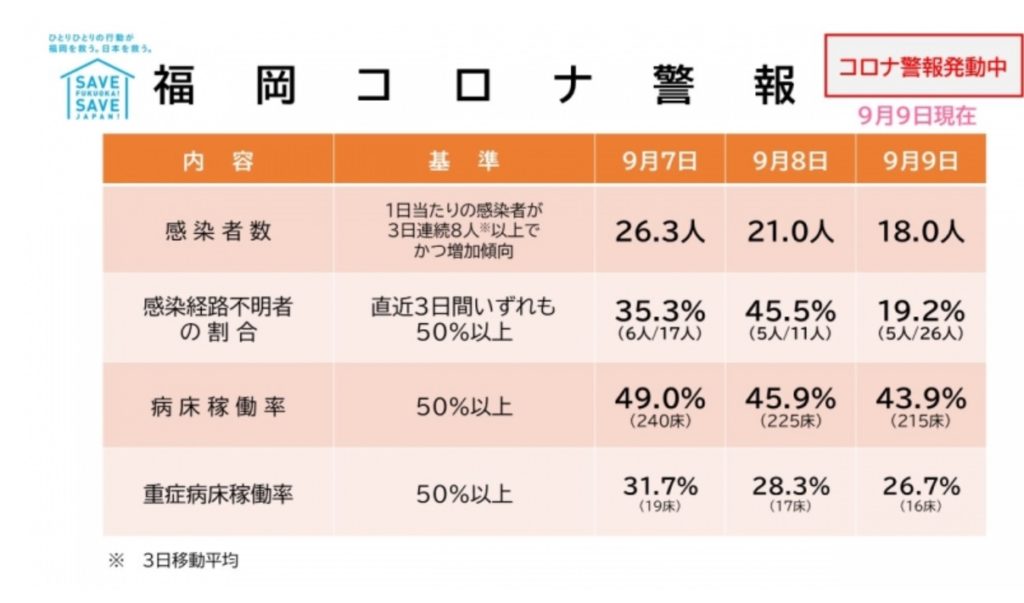
https://www.pref.fukuoka.lg.jp/contents/covid19-hassei.html
基準となる感染者数は10万人あたり0.16人(3日連続)となっています。(福岡の人口は515万人)
長崎
https://www.pref.nagasaki.jp/shared/uploads/2020/09/1599553738.pdf
新規報告者数については10万人あたり6.6人以上/週でステージ3、10万人あたり14.1人以上/週でステージ4、10万人あたり22.1人以上/週でステージ5となっています。(長崎の人口は137万人)
(分科会の指標に近いです)
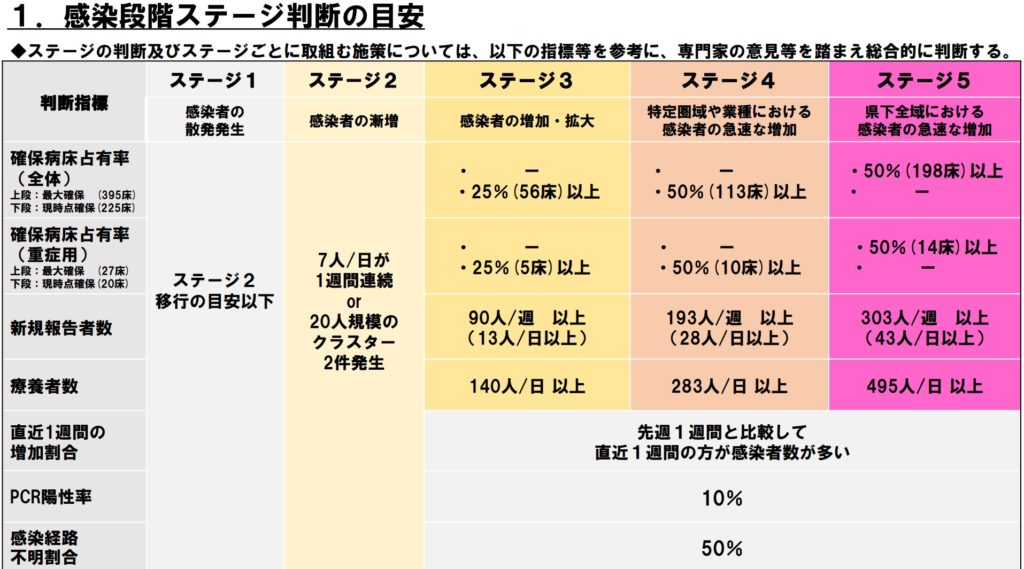
熊本
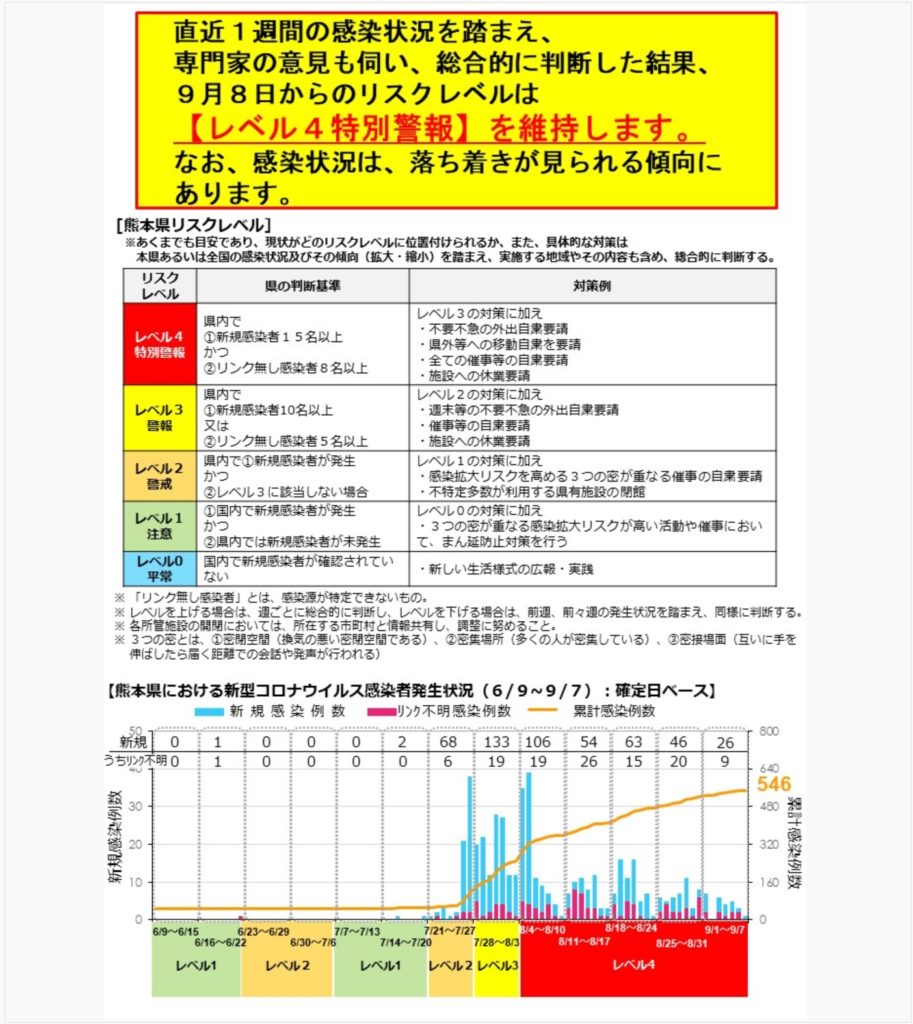
https://www.pref.kumamoto.jp/kiji_32638.html
新規感染者について10万人あたり0.56人以上で警報、10万人あたり0.84人以上で特別警報となっています。(熊本の人口は178万人)
(分科会指標の約4分の1)
宮崎
https://www.pref.miyazaki.lg.jp/kansensho-taisaku/covid-19/yobo/hassei.htm
具体的な数値は設定されていません。
沖縄
https://www.pref.okinawa.lg.jp/site/chijiko/koho/corona/documents/0911hanndansihyou.pdf
新規感染者数について10万人あたり2.7人以上/週で感染流行期、10万人あたり14.8人以上/週で感染蔓延期となっています(沖縄の人口は143万人)
佐賀、大分、鹿児島
なし
まとめると
モニタリング指標が無いからといって感染対策がいいかげんであるとまでは言えません。
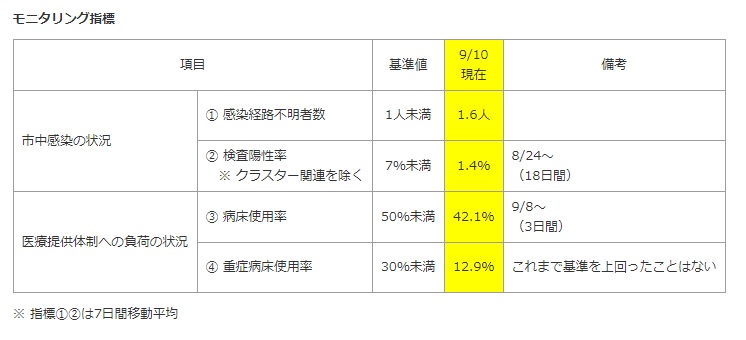
広島県にはモニタリング指標がありませんがコロナ関連の情報は充実しています。
しかし、モニタリング指標が無く、ホームページでのコロナ関連情報も不十分な自治体は今まで何をやっていたのかと思います。
WHOの基準では陽性率5%以内が少なくとも2週間以上続いた場合、感染が制御されていると判断するとしています。※
PCR検査陽性率を指標に取り入れている自治体は少ないです。
神奈川はK値をモニタリング指標として採用していましたが、いつの間にか消えていました。
滋賀は未だにK値をモニタリング指標に取り入れています。
分科会が設定した基準、ステージⅢの新規感染者数10万人あたり15人/週、ステージⅣの新規感染者数10万人あたり25人/週は明らかに多すぎます。
東京に当てはめるとステージⅢの新規感染者数は2026人/週、1日当たり289人、ステージⅣの新規感染者数は3377人/週、1日当たり482人となります。 (東京の人口は1351万人)
多くの自治体の新規感染者数の基準は分科会の基準以下です。
分科会が設定した基準はステージⅢ以上に極力ならないようにするための指標と言っても良いと考えます。
感染対策として分科会の指標に何の意味があるのでしょうか?
※ https://www.who.int/publications/i/item/public-health-criteria-to-adjust-public-health-and-social-measures-in-the-context-of-covid-19